Claudinator
Reads Claude Code's own transcripts and shows where the tokens went — per project, per agent, per day, with no API key.
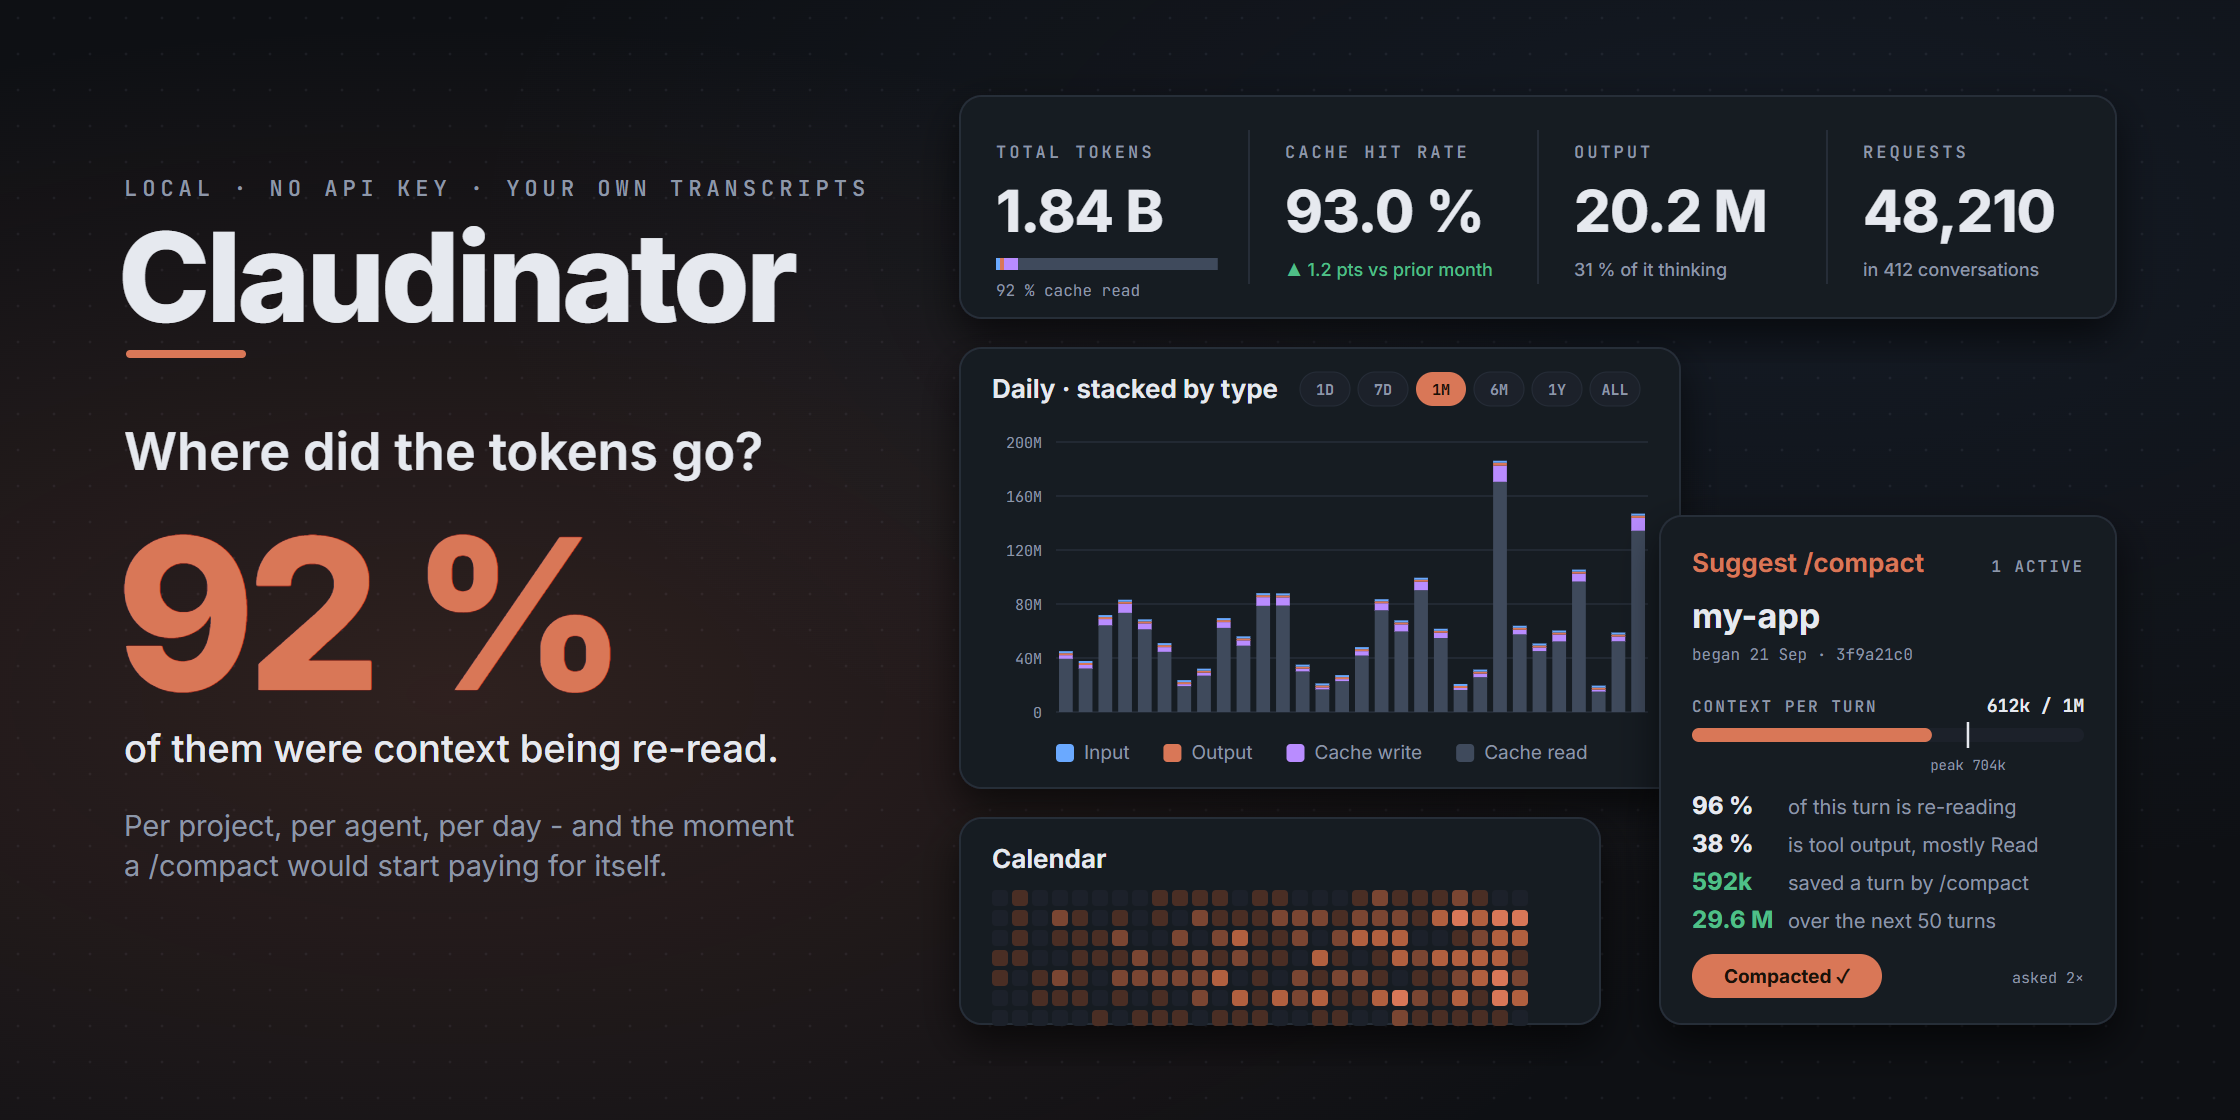
Claude Code already writes a full JSONL transcript of every session to disk, and every assistant response in those files carries a usage block: input, output, thinking, cache write and cache read. Claudinator reads those files, aggregates them and serves a single-page dashboard, so the question “where did the tokens actually go?” has an answer instead of a guess.
It is one Node script with no dependencies, no build step and no API key. The server binds to 127.0.0.1 and only ever reads files that are already on your disk. Nothing is uploaded and nothing is polled — you press FETCH.
The repository ships no data of any kind: no sample transcripts, no bundled numbers, no baked-in paths. Every figure is computed on your machine at the moment you ask for it, so two people running this see completely different dashboards.
What it shows
Headline numbers. Total tokens, estimated cost, output with its thinking share, cache hit rate, messages and active days, plus cards that only appear when they apply — one for fast-mode turns, one for server tools. Where a comparable previous window exists, every card also carries the change against it.
Cache never reused. The other side of the hit rate: cache writes that nothing read back before they expired. A five-minute write only pays off if the same conversation asks again within five minutes, so each write is checked against the next turn of that conversation, with subagents counted separately because they carry their own context.
A daily chart with two independent axes. Stack by type, project, model or effort level; measure in tokens, estimated cost or output alone. Long ranges bucket themselves into weeks and then months rather than turning into a picket fence.
When the work happened. A calendar heatmap, token totals by hour of day and by weekday, and the ten biggest days each naming the project that dominated it.
Breakdowns that filter. Per project, per agent, per model, per effort, every individual subagent launch by its task description, and the twenty-five largest sessions with their current context size. Click any row and the whole dashboard — every chart, card and panel — narrows to that slice. Filters show as chips, Escape clears them, and the CSV export follows whatever is currently selected.
Why a session gets expensive
Every main-thread turn re-reads the entire discussion, so the cost of a turn tracks the size of its context rather than the length of its answer. Claudinator measures that directly: for the newest main-thread turn of a session, input plus cache write plus cache read is exactly what the model had to read to reply.
Sessions past a threshold are grouped by project and given a card showing the context per turn against a 1M window and the peak it has reached, the cost of a turn right now and what share of it is pure re-reading, how many times the session has already been compacted — detected as a context drop of more than half between consecutive turns — what compacting would save per turn and over the next fifty, how much of the context is tool output and which tool dominates it, and a badge for sessions that have gone idle long enough that none of it matters until you resume them.
Two panels answer the follow-up question. Tool output ranks the tools by how many tokens they have poured into contexts, with call counts, the average per call and the largest single results, because one big result is re-read by every turn after it. Context growth is the measured counterpart: how many tokens were appended between one turn and the next, and the biggest jumps with the tools that ran inside them.
Marking a session compacted is a button, not a promise: the click is timestamped, only later turns count from then on, marks expire on their own, and an undo forgets the mark and measures the whole session again.
How the numbers are attributed
One record is one API response. The same message id is written once per streamed content block, so records are deduplicated on message and request id. That also makes backup folders safe to add, and local errors and interrupts are skipped because they were never API calls.
Projects follow the repository, not the folder. A session’s working directory is often a subfolder, so each one rolls up to its enclosing git repository, deepest one first so nested repos stay separate. A session started directly inside a folder that merely contains projects has no project of its own, so the absolute paths in its own tool calls are used instead: if one project takes at least 60% of at least three hits, the session is attributed there and the row says it was inferred. On the corpus this was built against, that moved 15 of 17 rootless sessions onto a real project and shrank the meaningless catch-all bucket from 460M tokens to 4M.
Subagents are joined from both ends. Each subagent transcript carries its agent id, and the session that spawned it holds the other half: the tool call that knows the agent type and the result that names the id. Joining the two is what turns a wall of anonymous transcripts into “this agent type, running this task”.
Where the estimates are, and why
Tool output is sized from the result content the model actually reads, at roughly four characters per token plus a flat allowance per image. The transcript line is deliberately not used as a proxy: it carries the payload a second time under its own metadata, so measuring the line roughly doubles the real figure.
It is tempting to attribute measured context growth to the individual tool results inside each gap, which would give exact per-tool counts. Checked against real transcripts, it does not hold. Aggregated over 3,550 turn gaps the growth implies 0.87 characters per token, which is impossible for text — the gap carries injected context, not only the tool result. The overhead is not a constant you can subtract either: turns where nothing arrived still grew by 97 tokens at the tenth percentile and 2,097 at the ninetieth. And over a thousand gaps run negative, because context editing and compaction remove more than the turn added.
Exact per-result counts would need either a published tokenizer for the current models or a call to a token-counting API, which would mean an API key and a network connection. Both were refused to keep the tool local and keyless, so per-tool figures are labelled estimates and the exactly measured per-turn growth is offered beside them.
Cost works the same way. Rates live in a pricing file you can edit, with the standard cache multipliers applied, and it is re-read on every fetch so nothing needs restarting. If a model turns up that the file does not list, a banner names it and says how much of the window was priced at the fallback rate — an unknown model silently costed at the wrong tier is how an estimate ends up several times wrong. It is an estimate, not a bill.
Running it
Node 18 or newer and nothing else. Clone it, start the server, open the port. Everything works unconfigured; an optional config file adjusts the folders to scan, the port, which folders count as containers rather than projects, and the compaction thresholds.
Transcripts are read a line at a time, so a file is never held in memory whole and a multi-gigabyte folder is not a problem. Parsed files are cached against their size and modification time, so only changed transcripts are re-read: a cold scan of about 90 MB takes roughly half a second and warm scans land near ten milliseconds.
MIT licensed.